 Rashid Mikidadi
Machine Learning · AI4ALL Ignite
Corporate Bankruptcy Prediction
An XGBoost model trained on 78,682 firm-year records that substantially outperforms the classic Altman Z-Score, deployed as an interactive Streamlit application.
Led modeling, helped deploy · Jun – Oct 2026
- 0.914
- ROC-AUC · vs 0.794 Altman Z-Score
- 0.163
- PR-AUC · vs 0.025 Altman Z-Score baseline
- 78,682
- firm-year records
The problem and the question
When a company goes bankrupt, the damage reaches far beyond the company itself: investors, lenders, employees, and suppliers all absorb part of the failure. In 2025 alone there were more than 24,000 U.S. business bankruptcy filings. Spotting financial distress early matters, and the tool finance has leaned on for that job, the Altman Z-Score, dates to 1968. It is a fixed linear formula that applies the same weights to every firm, which means it can miss the complex, non-linear warning patterns in modern financial data.
This was our AI4ALL Ignite group project, Predicting U.S. Corporate Bankruptcy: Beyond the Altman Z-Score, built by a team of four between June and October 2026. Our research question: can machine-learning models trained on financial statement data predict whether a U.S. public company will file for bankruptcy in the following fiscal year more accurately than the Altman Z-Score, while also identifying which financial variables are the strongest early warning signals?
The dataset, and why we split it by time
We worked with the American Companies Bankruptcy Prediction Dataset: 78,682 firm-year observations covering 8,971 U.S. public companies from 1999 to 2018. It is panel data, meaning the same company appears across multiple years, about nine and a half on average. That shape has a trap in it: shuffle the rows randomly into train and test sets, and the model sees a company's future while being evaluated on its past. The results would look great and mean nothing.
So the team split strictly by time: train on 1999 to 2011, which forces the model to learn through the 2008 financial crisis, validate on 2012 to 2014, and test on 2015 to 2018. The model has to predict forward, the way it would be used in reality.
The second structural challenge is imbalance. Only 0.77% of firm-years end in bankruptcy, so a model that just predicts "everyone survives" is about 99% accurate while catching nothing. Accuracy was never going to be the right yardstick, and that decision shaped the whole evaluation.
My modeling approach
My primary role on the team was the modeling: building the models, comparing them, evaluating performance, and interpreting what they learned. We first established the Altman Z-Score itself as the benchmark to beat, then I compared four learned models against it: logistic regression, a decision tree, a random forest, and XGBoost as our primary model.
XGBoost is a gradient-boosted decision tree algorithm. It learns from financial statement variables and engineered financial ratios covering liquidity, profitability, and leverage, including the five components of the Altman Z-Score itself, so the comparison with the 1968 formula is as direct as possible. Instead of producing a bare yes-or-no label, the model outputs a calibrated bankruptcy probability, which is far more useful for ranking and reviewing risk.
Evaluation: picking metrics that can't lie
We evaluated every model with two views: ROC curves, which measure how well a model ranks bankrupt firms above healthy ones, and precision-recall curves, which show what happens to precision as you try to catch more of the actual bankruptcies. With positives this rare, PR-AUC is the demanding metric: a random guesser scores roughly the prevalence, about 0.01, so there is nowhere to hide.
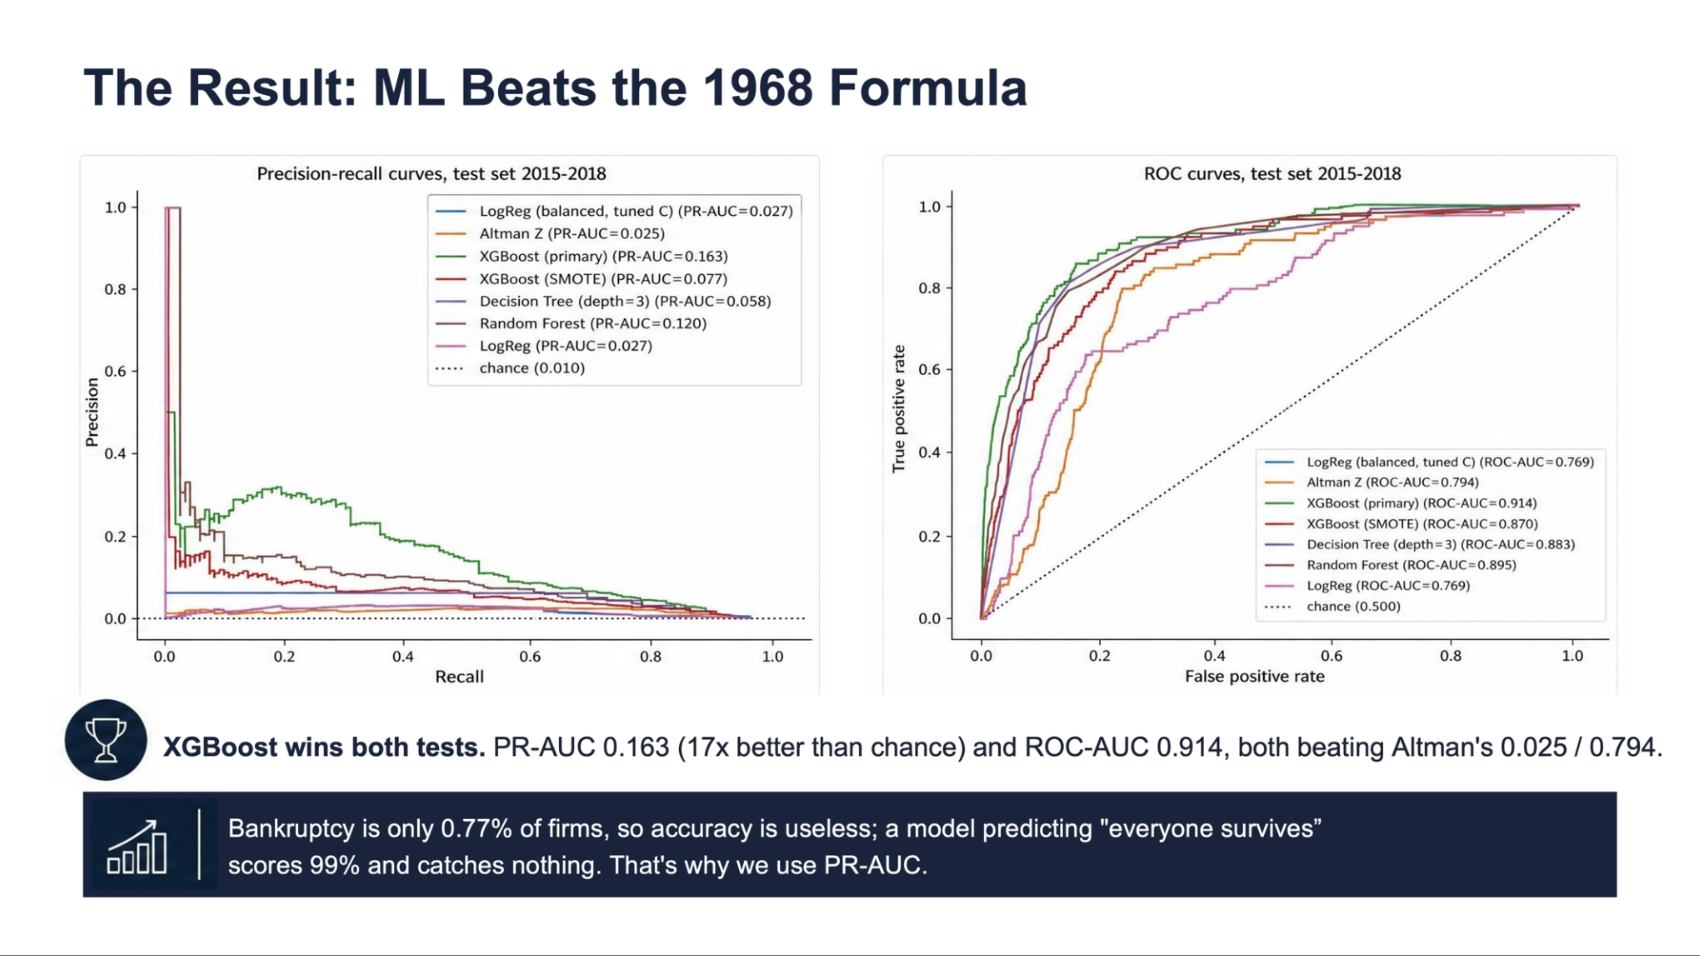
XGBoost won both tests. It reached a ROC-AUC of 0.914 against 0.794 for the Altman Z-Score, and a PR-AUC of 0.163 against Altman's 0.025 on the same task: roughly six and a half times better at concentrating true bankruptcies among its top-ranked predictions, and about 17 times better than chance.
The number I find most tangible is false alarms. In the comparison our team evaluated for the final presentation, run on the same test set, the Z-Score produced 4,925 false positives against 350 from our model at the decision thresholds the team compared: a reduction of over 90%. That is the difference between a warning system that buries analysts in noise and one whose flags are worth investigating. To be clear about what these numbers are not: PR-AUC of 0.163 is not "16% accuracy" or anything like it, and none of this makes the model ready to drive real-world financial decisions on its own. It shows that learned models can rank risk far better than a fixed 1968 formula on this data.
Opening the box with SHAP
A risk score nobody can interrogate doesn't get trusted, so explaining predictions mattered as much as making them. We used SHAP values to break down exactly which financial variables pushed each company's predicted risk up or down.
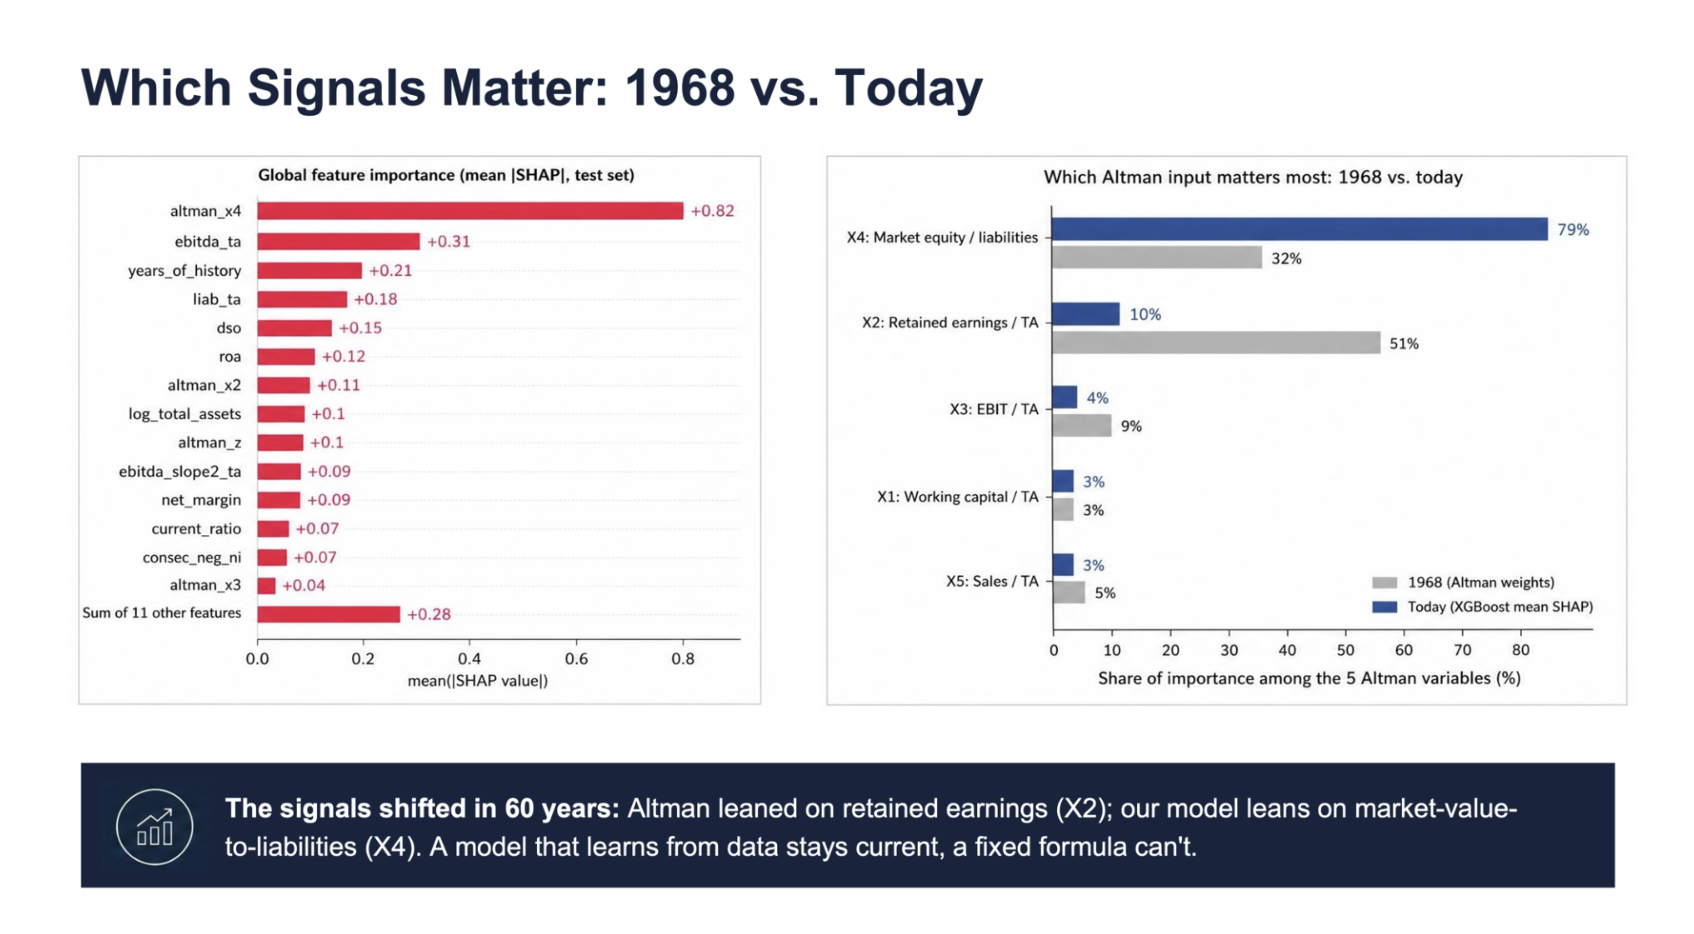
The strongest global signal in our model turned out to be the ratio of market value to liabilities, Altman's X4 component. That is interesting because Altman's original 1968 formula leaned hardest on retained earnings, his X2. On this dataset at least, the signals that matter have shifted over sixty years, and a model that learns from data keeps up with that shift while a fixed formula cannot. I wouldn't claim this proves a universal change in why companies fail, but it is exactly the kind of insight a learned, explainable model surfaces and a static formula hides.
From model to demonstration app
An accurate model locked in a notebook helps nobody, so the team built and deployed a Streamlit demonstration application around it; I helped with the deployment and presented the walkthrough. You can enter a company's financials manually or upload a CSV of multiple companies, and the app returns a calibrated bankruptcy probability, a risk category, an Altman Z-Score comparison, and a SHAP waterfall explaining which variables raised or lowered that company's risk.
It is a decision-support demonstration, not a production financial-risk platform. The point was to show the full path: data to model to explanation to something a person can actually use.
Limitations, lessons, and what's next
A model like this is only as honest as its understanding of its own limits, and ours has several. The class imbalance is severe. There is temporal bias: the 2008 crisis sits in the training window while the test years were mostly economic expansion, and firms behave differently across those regimes. There is survivorship bias, because companies that were acquired or voluntarily delisted count as alive even when distress drove the exit. There is selection bias, since the data covers only NYSE and NASDAQ public companies, so nothing here generalizes to private firms or small businesses. And there are omitted variables: no industry labels and no cash-flow data, which means the model cannot see sector norms or liquidity directly.
We also had to adapt our plans to the data. We originally wanted to predict bankruptcy over multiple future years, but the dataset only supports a one-year horizon, so that is what we built and that is all we claim.
Metric choice is a modeling decision. On imbalanced problems, accuracy flatters any model; the PR-AUC comparison against an honest baseline is what shows real progress.
Future directions the team identified: adding sector information and operating cash-flow data, extending the prediction horizon, and releasing the application publicly with documentation and reproducible code.